
The Lamar Jackson Collection
| Year | Team | G | GS | QBRec | Comp | Att | Comp% | Yards | TD | Int | Lng | Y/A | Rate | QBR | Rush | Yds | Y/A | TD |
| 2015 | Louisville | 12 | 7-5 | 135 | 247 | 54.7 | 1840 | 12 | 8 | 7.4 | 126.8 | 163 | 960 | 5.9 | 11 | |||
| 2016 | Louisville | 13 | 9-4 | 230 | 409 | 56.2 | 3543 | 30 | 9 | 8.7 | 148.8 | 260 | 1571 | 6.0 | 21 | |||
| 2017 | Louisville | 13 | 8-5 | 254 | 430 | 59.1 | 3660 | 27 | 10 | 8.5 | 146.6 | 232 | 1601 | 6.9 | 18 | |||
| 2018 | Baltimore | 16 | 7 | 6-1 | 99 | 170 | 58.2 | 1201 | 6 | 3 | 74 | 7.1 | 84.5 | 42.6 | 147 | 695 | 4.7 | 5 |
| 2019 | Baltimore | 15 | 15 | 13-2 | 265 | 401 | 66.1 | 3127 | 36 | 6 | 83 | 7.8 | 113.3 | 83.0 | 176 | 1206 | 6.9 | 7 |
| 2020 | Baltimore | 15 | 15 | 11-4 | 242 | 376 | 64.4 | 2757 | 26 | 9 | 47 | 7.3 | 99.3 | 67.3 | 159 | 1005 | 6.3 | 7 |
| 2021 | Baltimore | 12 | 12 | 7-5 | 246 | 382 | 64.4 | 2882 | 16 | 13 | 49 | 7.5 | 87.0 | 56.8 | 133 | 767 | 5.8 | 2 |
| 2022 | Baltimore | 12 | 12 | 8-4 | 203 | 326 | 62.3 | 2242 | 17 | 7 | 75 | 6.9 | 91.1 | 61.1 | 112 | 764 | 6.8 | 3 |
| 2023 | Baltimore | 16 | 16 | 13-3 | 307 | 457 | 67.2 | 3678 | 24 | 7 | 80 | 8.0 | 102.7 | 65.4 | 148 | 821 | 5.5 | 5 |
| 2024 | Baltimore | 17 | 17 | 12-5 | 316 | 474 | 66.7 | 4172 | 41 | 4 | 84 | 8.8 | 119.6 | 74.8 | 139 | 915 | 6.6 | 4 |
| 2025 | Baltimore | 13 | 13 | 6-7 | 192 | 302 | 63.6 | 2549 | 21 | 7 | 64 | 8.4 | 103.8 | 62.7 | 67 | 349 | 5.2 | 2 |
| 3-years | College Totals | 38 | - | 24-14 | 619 | 1086 | 57.0 | 9,043 | 69 | 27 | - | 8.3 | 142.9 | - | 655 | 4132 | 6.3 | 50 |
| 8-years | NFL Totals | 116 | 107 | 76-31-0 | 1870 | 2888 | 64.8 | 22,608 | 187 | 56 | 84 | 8.3 | 102.2 | - | 1081 | 6522 | 6.0 | 35 |
Career highlights & awards
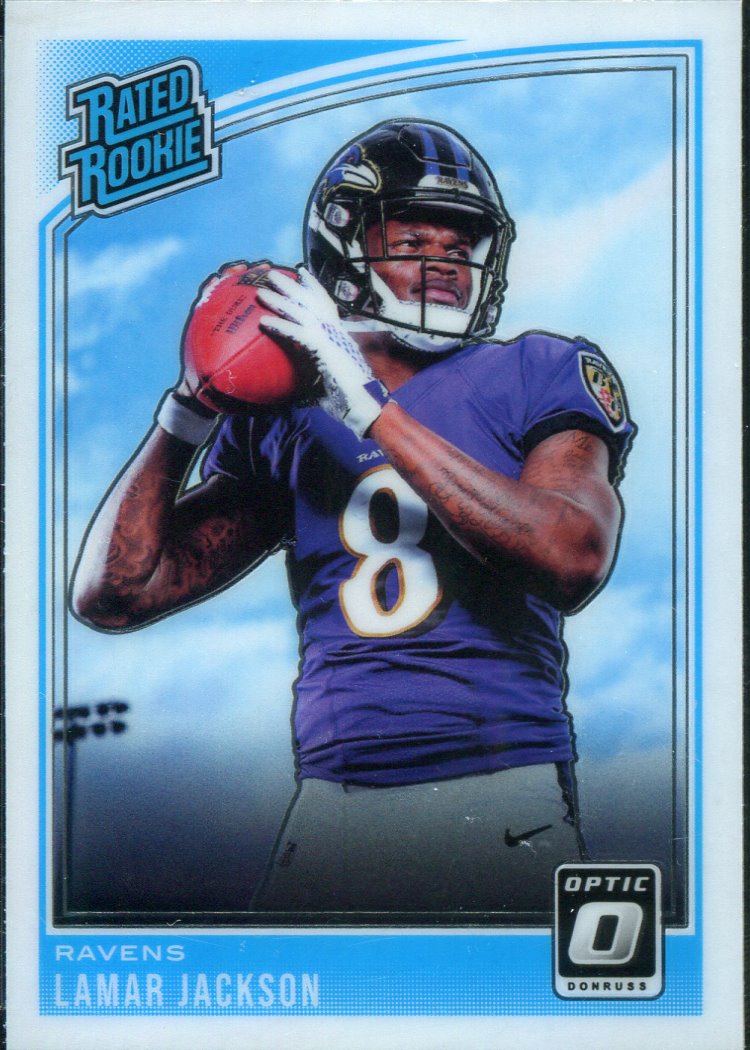
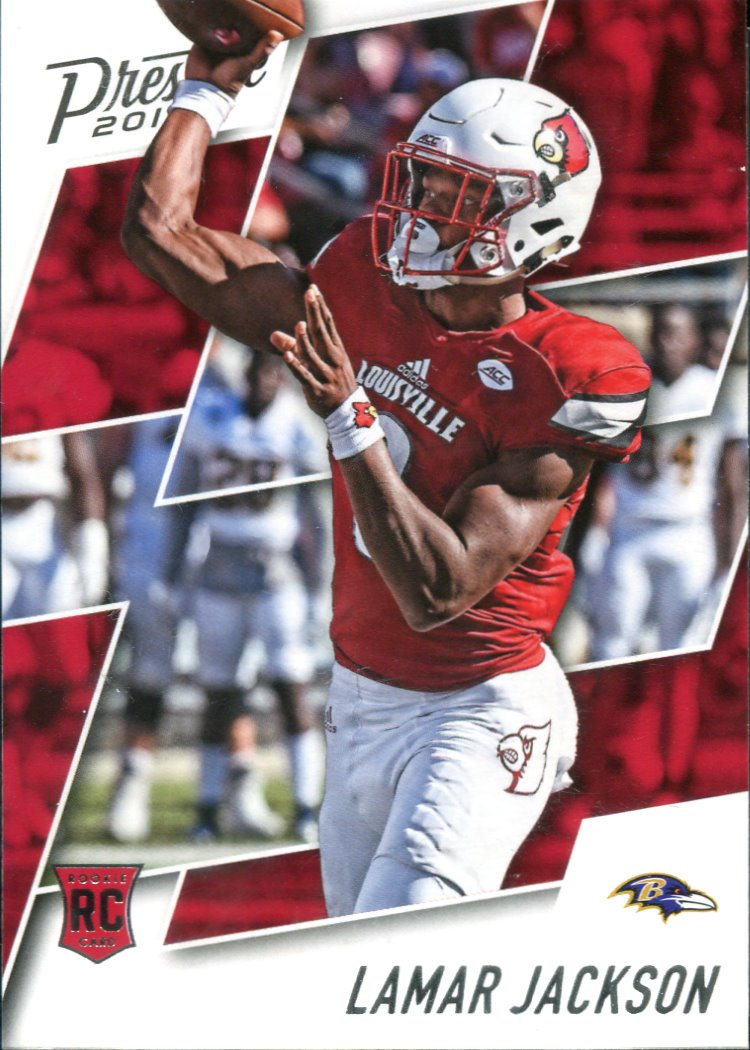
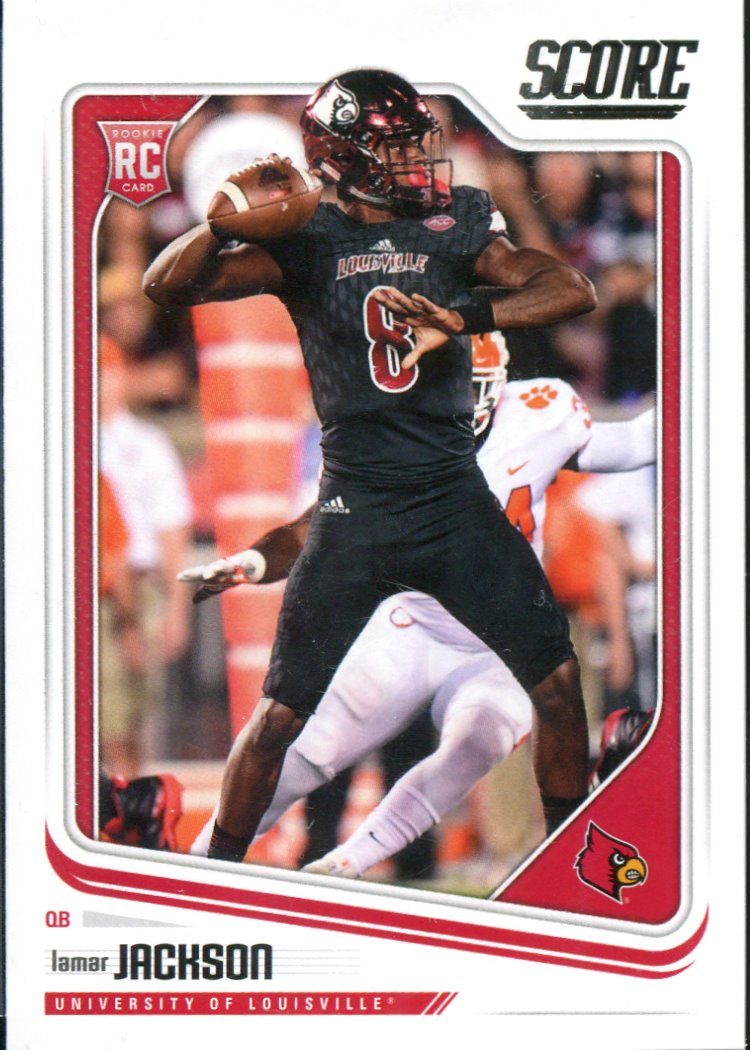
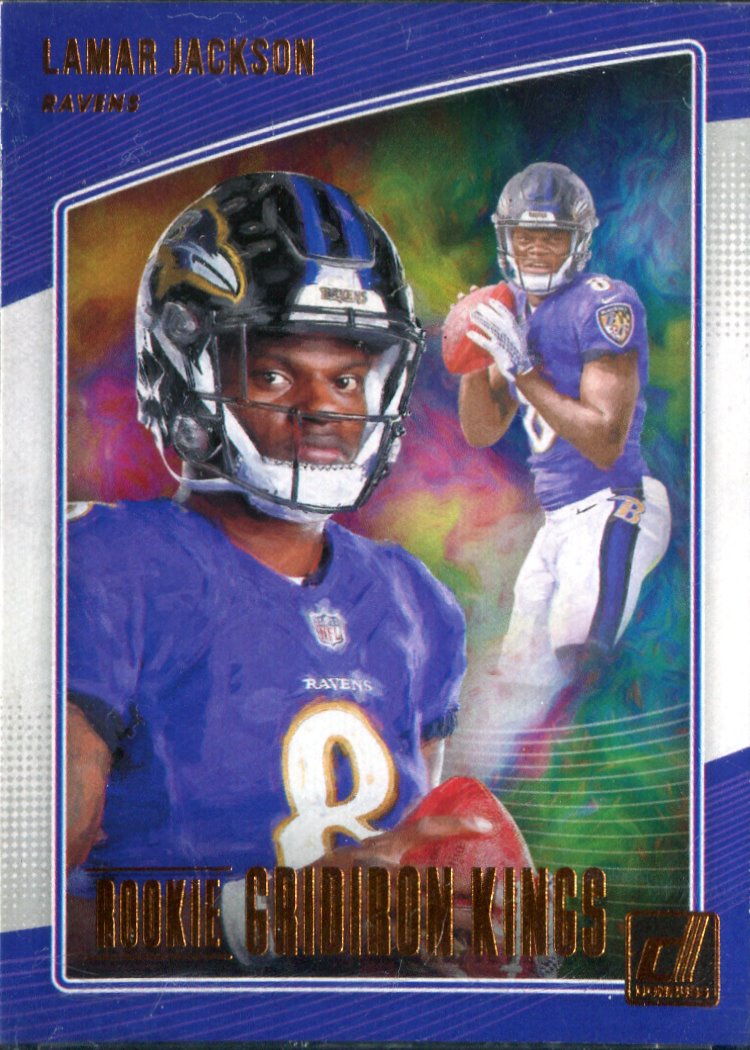
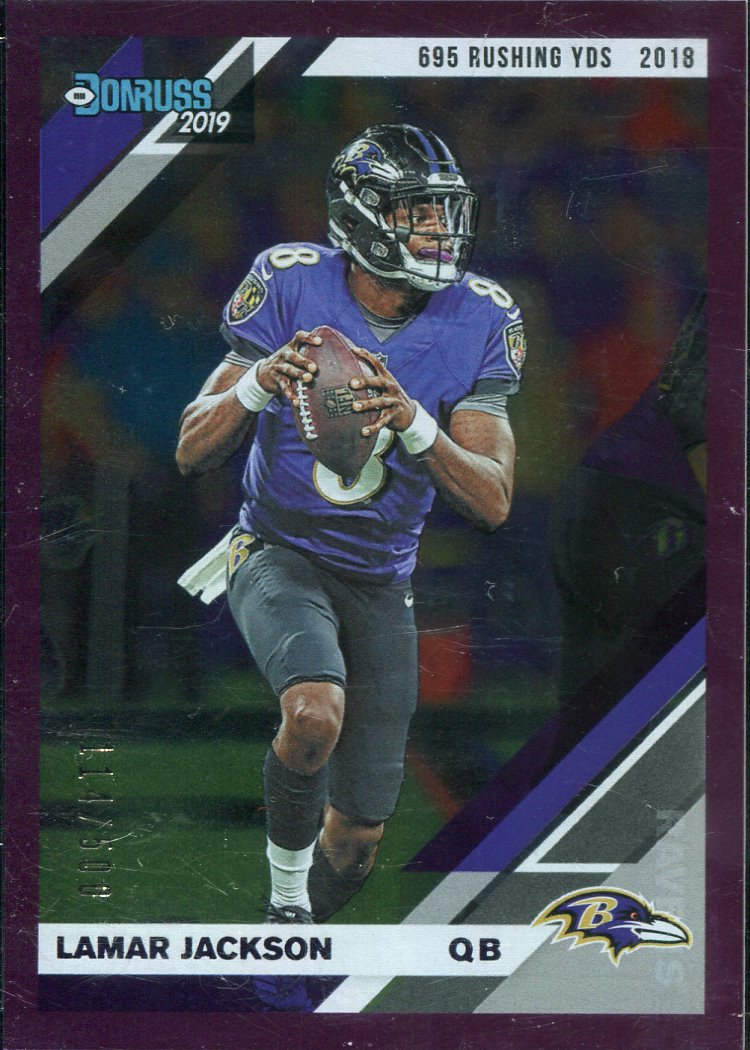
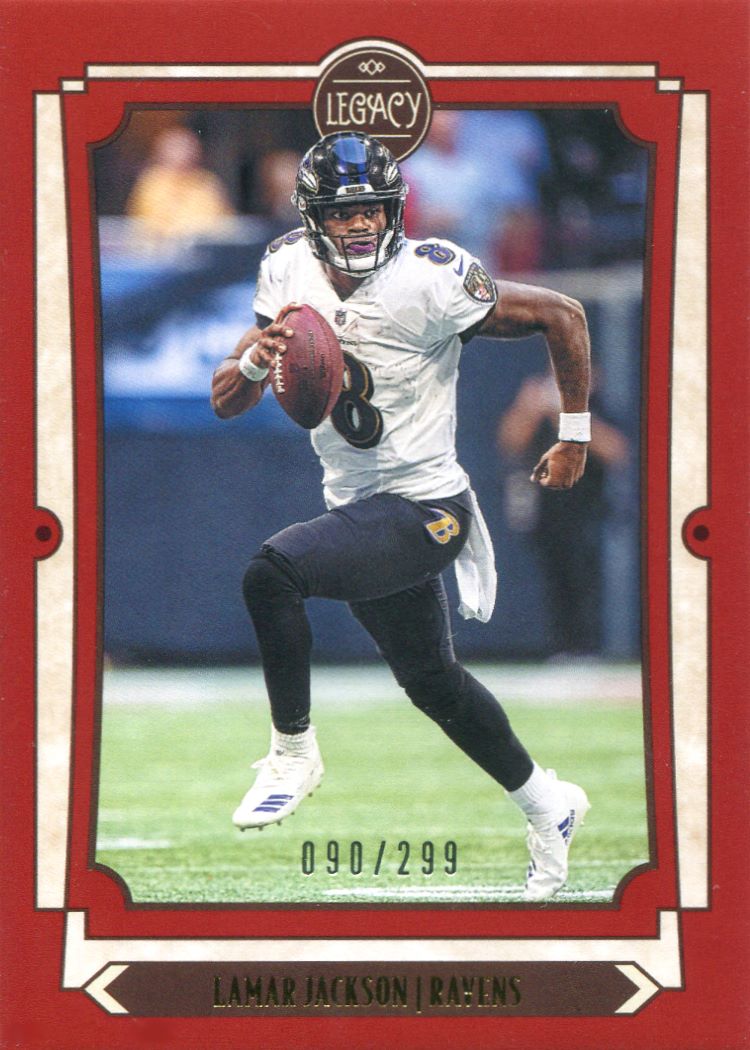
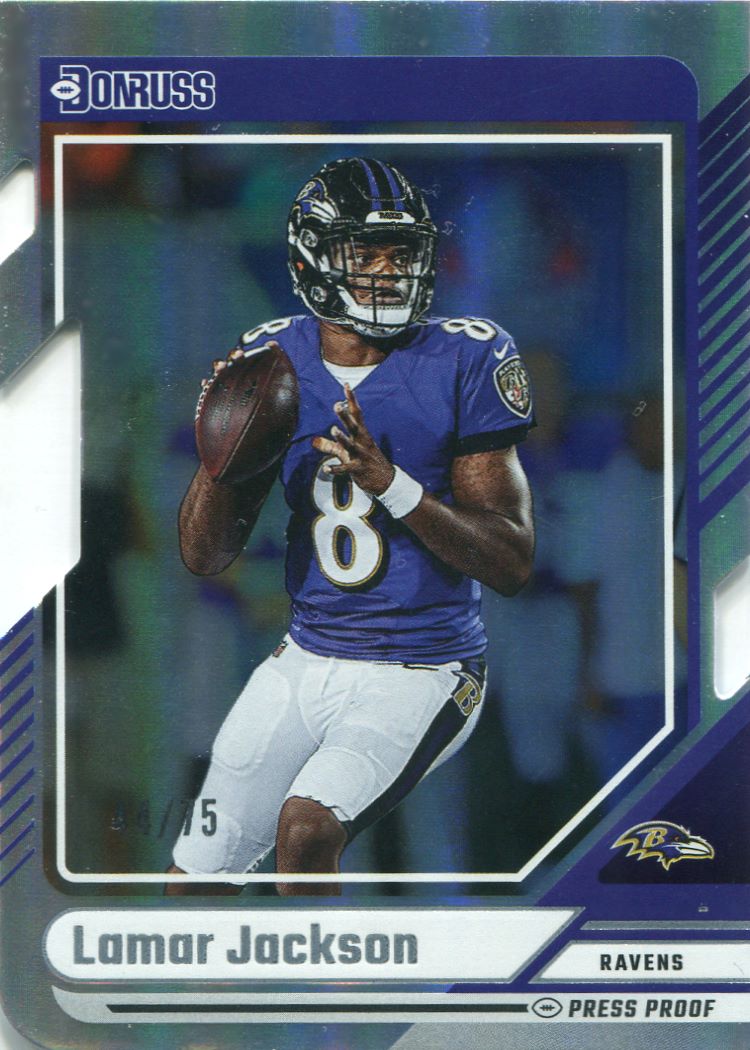
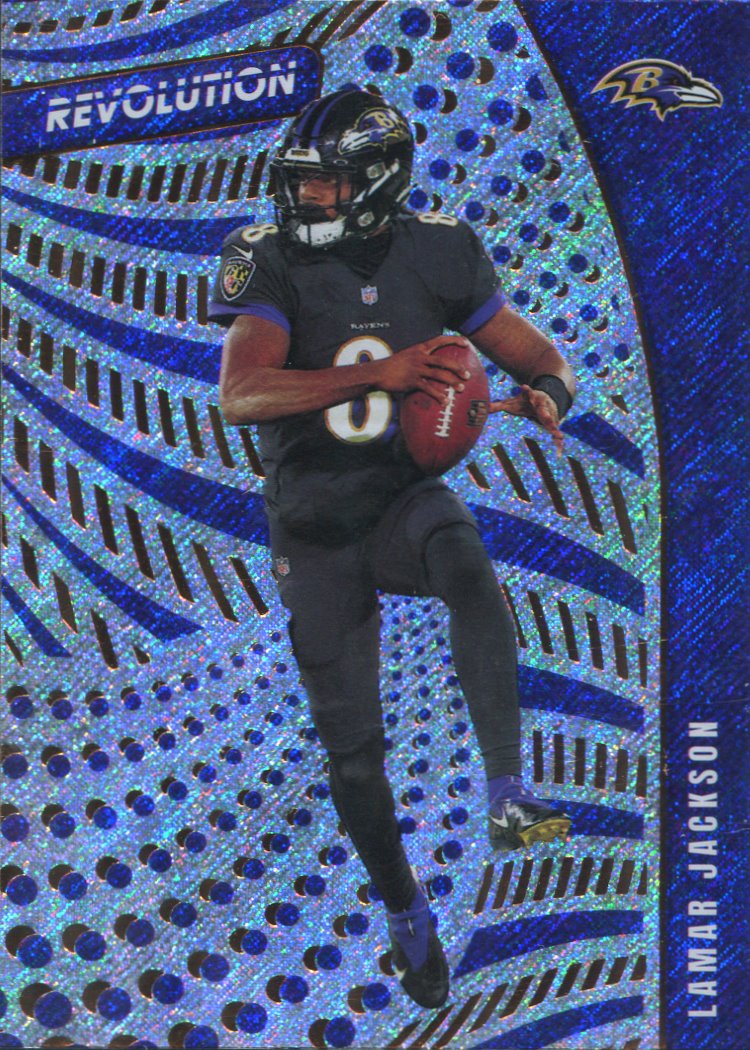
Football Card Gallery
 |
 |
 |
 |
 |
 |
 |
 |
|
 |
 |
 |
 |
 |
 |
 |
||